


Sector: Tankers
Have you read the news of low/negative oil prices and wondered what it means? Cheap gasoline maybe?
The answer is to take a look at oil-tankers.
Overview
Shipping market cycle
Contango
Pricing
Conclusion
Overview
Supply chain

The Asset
Crude oil tankers come in various sizes, the biggest standard size being a Very Large Crude Carrier – or 'VLCC'. These tankers take up to 2 million barrels of crude oil per shipment, while the second largest size is the 'Suezmax' which takes around half of that amount and is the largest size ship that can sail through the Suez Canal fully laden. The smallest size of dedicated crude oil tankers is an 'Aframax' which can carry around 600,000 barrels of oil. There are smaller tankers in the market, but these tend to carry refined oil products and fuel oil, not crude oil.
Construction of crude oil tankers takes 9 to 15 months from the time the keel is first laid. This means that it will take at least two years from the time of newbuilding contract signature (ordering) until the vessel is delivered
because many critical parts are long-lead items that needs to be ordered and produced before the construction of the ship can commence. Their sheer size dictates that there is a limited number of sites capable of building them and these are concentrated in Asia, more specifically in South Korea, China, and Japan. The price for contracting a tanker newbuilding is influenced by a number of factors such as the underlying price of energy, steel, labor costs and available construction finance.
Over the last ten years the cost of a new VLCC has ranged from around USD 80 million to USD 160 million. The economic lifespan of an oil tanker has historically been 25 years, although more recently this has dropped closer to 20 years.
The Cost Structure
Earnings are reported by companies and market watchers in terms of 'dollars per day' also known as the Time Charter Equivalent (TCE). The cash breakeven TCE for a VLCC is between USD 20,000 per day to USD 35,000 per day.
Gross Revenue: Money agreed with charterer to cover entire voyage from A to B
Voyage Expenses: Cost of fuel, port stay, tolls, cargo handling, commission
Net Revenue: Gross revenue minus voyage expenses
Vessel Expenses (OPEX): cost of crew, vessel stores & supplies, lubrication, oils, insurance

Price of Oil – impact on tankers
Like any commodity, the greater the demand for it, the more demand for its transportation.
Crude is no different and the sharp reduction in the price of oil the market experienced from the fourth quarter of 2014 prompted a boost in demand in both the U.S. and Europe where oil demand is highly price sensitive.
With improved demand for oil products, more crude oil was needed by refineries worldwide. These refineries are rarely located close to the sources of crude oil, so more oil tankers were needed to transport the crude from oil field to refinery. Generally speaking the lower the oil price the stronger demand for it. However the relationship is not linear. Ships also burn oil as fuel so high prices increase costs of transport.
Key Market Drivers – Demand for Oil
The demand for oil is an obvious driver of crude tanker demand; the more oil that is needed around the world, the bigger the demand for moving this oil from production to refinery.
Global demand for oil has generally been rising year-on-year with the average growth rate from 1990 being 1.1 million barrels per annum. Since 2015 this growth rate has been above trend and is forecast to remain so until 2022.
Translating oil demand growth into actual vessel demand is an inexact science as many factors impact how this oil is being traded and what means of transportation is used to move it. A rough calculation looks something like this: demand growth of say 1 million barrels per day equates to 365 million barrels per year. If all this incremental demand was shipped and carried on VLCCs in 2 million barrel parcels this would be an additional 182 cargoes per year.
With a VLCC performing on average six voyages a year we can conclude that these additional cargoes would require around 30 extra ships provided all the additional demand is carried by sea.
Key Market Drivers – Supply of Oil
Oil supply dynamics have undergone a transformation in the past decade, away from being very Middle East focused to having a more diverse supply base, in particular with the development of U.S. shale oil.
Key Market Drivers – Vessel Supply
On a global scale the supply of ships is a function of how many newbuild ships are delivered versus how many ships are removed from the fleet.
Trade Routes & Dynamic Market
The different sizes of ships cater for different trade routes. We have already discussed how smaller ships carry oil products, but within the crude tanker segment we also see a divergence. Economies of scale dictate that. The size of a VLCC makes them more cost efficient for longer international trade routes between large ports that can physically accommodate their larger size. The smaller the vessel size, the more regional the trade routes become.
Seasonality and Cyclicality
Historically, there has been a visible degree of seasonality in the tanker market as freight rates have tended to perform better during the first quarter and the fourth quarter of a calendar year. With 90% of the global population living in the northern hemisphere, more oil is required during the northern hemisphere winter hence more oil is consumed during these quarters.
However this marked contrast in seasonality has been less evident in recent years.
This can be explained by most demand growth now originating from Asia, where oil demand is less affected by seasonal consumption patterns.

Tanker shipping is a highly cyclical business with freight rates driven by numerous factors, but in the medium to long-term vessel supply and demand are the main drivers. Vessel supply is the one factor controlled by the shipping industry and the supply of vessels is impacted largely by capital flows into and out of the sector, but also availability of financing from banks and other investors. A tanker market cycle generally begins with an oversupplied market where too many ships depress any earnings and therefore the capital flows out of the sector.
Source: https://www.euronav.com/media/65361/special-report-2017-eng.pdf
Shipping Market cycle
Two views:
A sequence of three events: a trade boom, a short shipping boom during which there is overbuilding, followed by a ‘prolonged’ slump.
First, a shortage of ships develops, second, high freight rates stimulate over-ordering of the ships in short supply which finally leads to market collapse and recession.

Stage 1: Trough
We can identify three characteristics of a trough. First, there will be evidence of surplus shipping capacity. Ships queue up at loading points and vessels at sea slow steam to save fuel and delay arrival.
Secondly freight rates fall to the operating cost of the least efficient ships in the fleet which move into layup.
Thirdly, sustained low freight rates and tight credit create a negative net cashflow which becomes progressively greater. Shipping companies short of cash are forced to sell ships at distress prices, since there are few buyers. The price of old ships falls to the scrap price, leading to active demolition market.
Stage 2: Recovery
As supply and demand move towards balance, the first positive sign of a recovery is positive increase in freight rates above operating costs, followed by a fall in laid up tonnage.
Market sentiment remains uncertain and unpredictable. Spells of optimism alternate with profound doubts about whether a recovery is really happening (sometimes the pessimists are right, as shown by the false recovery in periods 7 to 9 in Figure 2.1). As liquidity improves second-hand prices rise and sentiment firms.
Stage 3: Peak/Plateau
When all the surplus has been absorbed the market enters a phase where supply and demand are in tight balance.
Freight rates are high, often two or three times operating costs.
The peak may last a few weeks or several years, depending on the balance of supply/demand pressures. Only untradeable ships are laid up; the fleet operates at full speed; owners become very liquid; banks are keen to lend; the press report the prosperous shipping business; there are public flotations of shipping companies. Secondhand prices move above ‘book value’ and prompt modern ships may sell for more than the newbuilding price.
The shipbuilding orderbook expands, slowly at first, then more rapidly.
Stage 4: Collapse
When supply overtakes demand the market moves into the collapse phase. Although the downturn is generally caused by fundamental factors such as the business cycle, the clearing of port congestion and the delivery of vessels ordered at the top of the market, all of which take time, sentiment can accelerate the collapse into a few weeks. Spot ships build up in key ports.
Freight rates fall, ships reduce operating speed and the least attractive vessels have to wait for cargo.
Liquidity remains high. Sentiment is confused, changing with each rally in rates.
Source: https://www.amazon.com/Maritime-Economics-3e-Martin-Stopford-ebook/dp/B0020BUXHW
Contango
Contango is a situation where the futures price of a commodity is higher than the spot price. Contango usually occurs when an asset price is expected to rise over time. That results in an upward sloping forward curve.
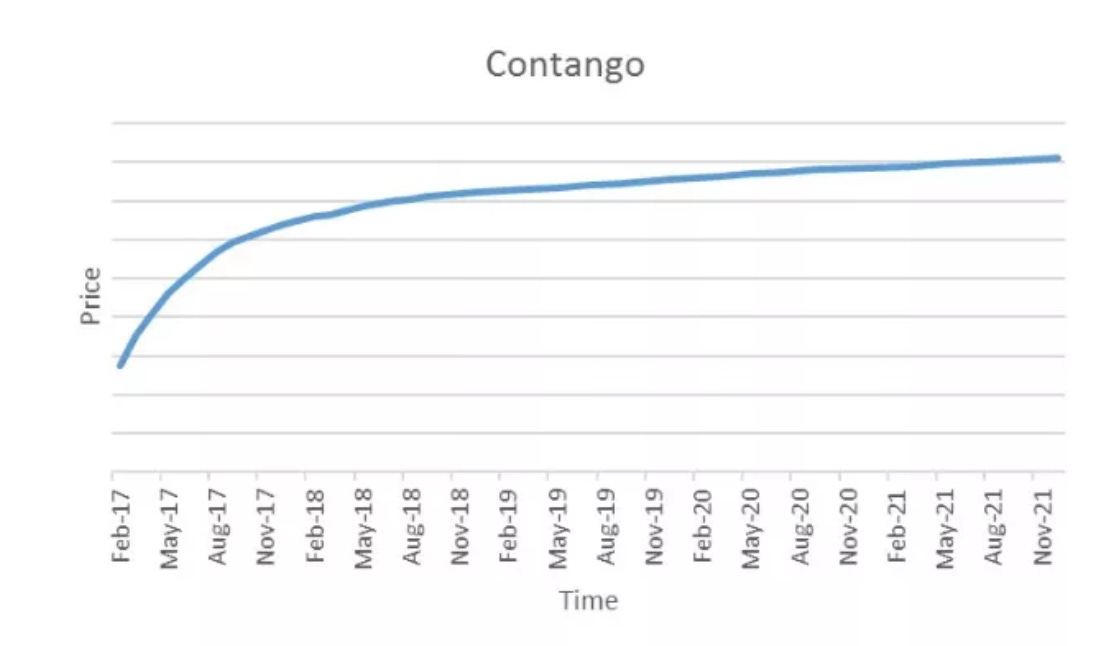
In contango, investors are willing to pay more for a commodity in the future. The premium above the current spot price for a particular expiration date is usually associated with the cost of carry.
Cost of carry can include any charges the investor would need to pay to hold the asset over a period of time. With commodities, the cost of carry generally includes storage costs.
Source: https://www.investopedia.com/terms/c/contango.asp
Current oil-contango

Pricing

Imagine that it cost $100,000 to build a condo. Under normal circumstances, you can rent for an amount that allows you to have net income of $833 per month or $10,000 per year. Let's ignore mortgage. Under such a scenario, you are making 10 percent on your money. Then, something weird like Coronavirus happens and your town is the only town that can cure it. As a result, loads of people start moving into your town skyrocketing rental income. Now instead of making $2,500 per quarter, you are making $100,000 per quarter. You double your money every quarter.
Would you sell your condo to somebody else for $100,000? Absolutely not. You are not that dumb. You would milk that cash flow for as long as you can and the last thing you would worry about is how long the rental rates will stay high. This is what we have in the oil tankers right now but even better because instead of buying that condo for $100,000, you can buy it for $50,000 and still make $100,000 per quarter because many of the oil tanker stocks are selling for less than their liquidation values.
The bears say, "But the rates will collapse?" Ok, so what? Are the oil tanker stocks trading at multiple times NAV? Are they trading for 10 times current run-rate earning? When they do, then we can talk about a bearish case.
Source: https://seekingalpha.com/article/4339999-bearish-thesis-for-oil-tankers-is-absolutely-ridiculous
Conclusion
Oil-contango extremely profitable short-term. From average rates of around 30k-40kUSD/day to rates of 100k++ USD/day. And the costs remain fixed.
Pricing most likely on the low end. Many companies are trading below their NAV(Net Asset Values) at a time where earnings are well above the average. This could have made sense if the NAVs had risen in line with the rising earnings, but so far that has not been the case.
The cocktail of Corona-virus, oil-crash and a liquidity crisis causes demand-uncertainity in the longer term. However, rates are not simply a function of demand, but the equlibrium between supply and demand. Uncertainty will also make it less tempting to order new ships.